There are many factors that can influence whether or not a campagin will be successful, will fail or will be cancelled, such as monetary conrtibutions, location, and launch date, to name a few. Reviewing and analyzing data from past campaigns can aid investors and campaign managers in making informed decision to increase the likelihood of success.
Given a dataset with over 4000 campaign projects, the aim of this project was to determine the factors that can potentially contribute to a successful theater play. Specifically, the project aimed to:
- determine potentially the best time, if any, to release a theater campaign to attain success, and subsequently to determine if any particular period should be avoided to prevent failure or cancellation
- investigate how the funding goal affects the outcome. In other words, is there any correlation between the outcomes ‘successful’, failed’ and ‘cancelled’, and funding goals.
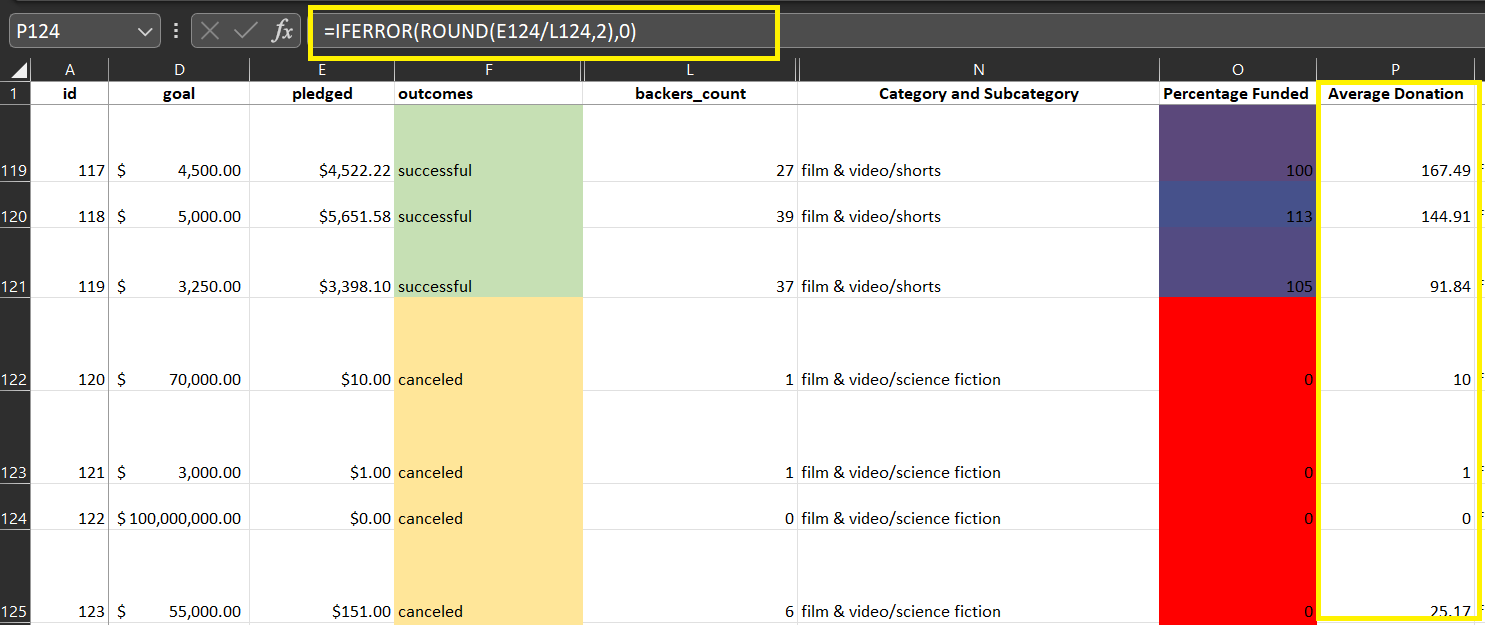
The dataset contains information such as funding goal, pledged monetary contributions and the numbers of backers. Vital to the analysis is the average donations (pledged) which was calculated from the two later categories. Since some campaigns had no backers, the "IFERROR" function in Excel was used to debugg the error as shown in the figure below.
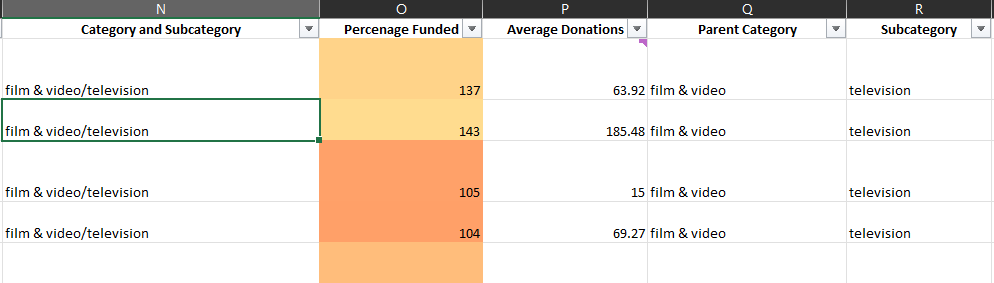
The original dataset contains information about each campaign in categories which was divided into specific categories since the scope of this project was to focus on theater plays. This is illustrated in the figure below.
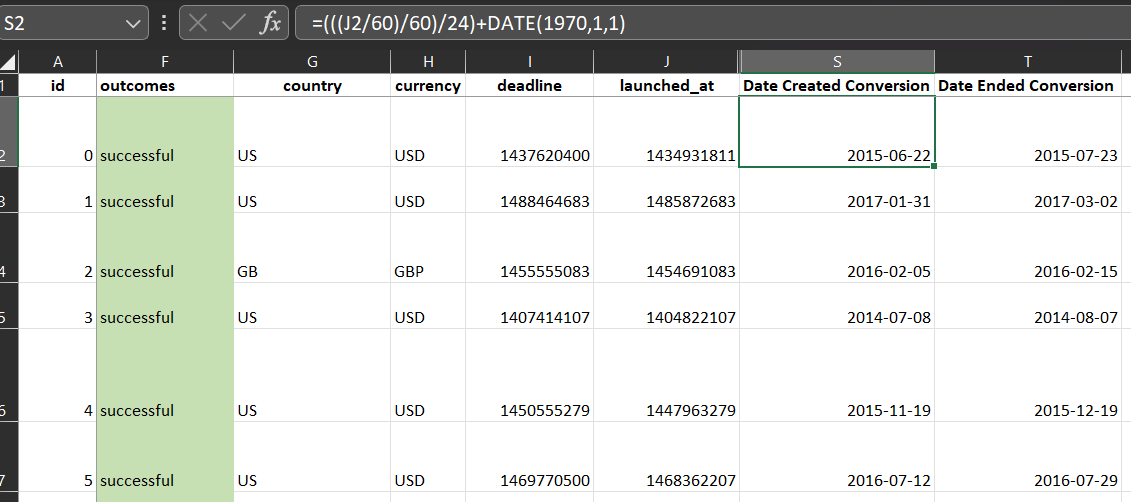
Another valuable piece of data is the length of fundraising campaigns. The provided data was in Unix timestamps and this was converted to a more readable format as shown in the figure below.
The following steps were utilized in analyzing the data:
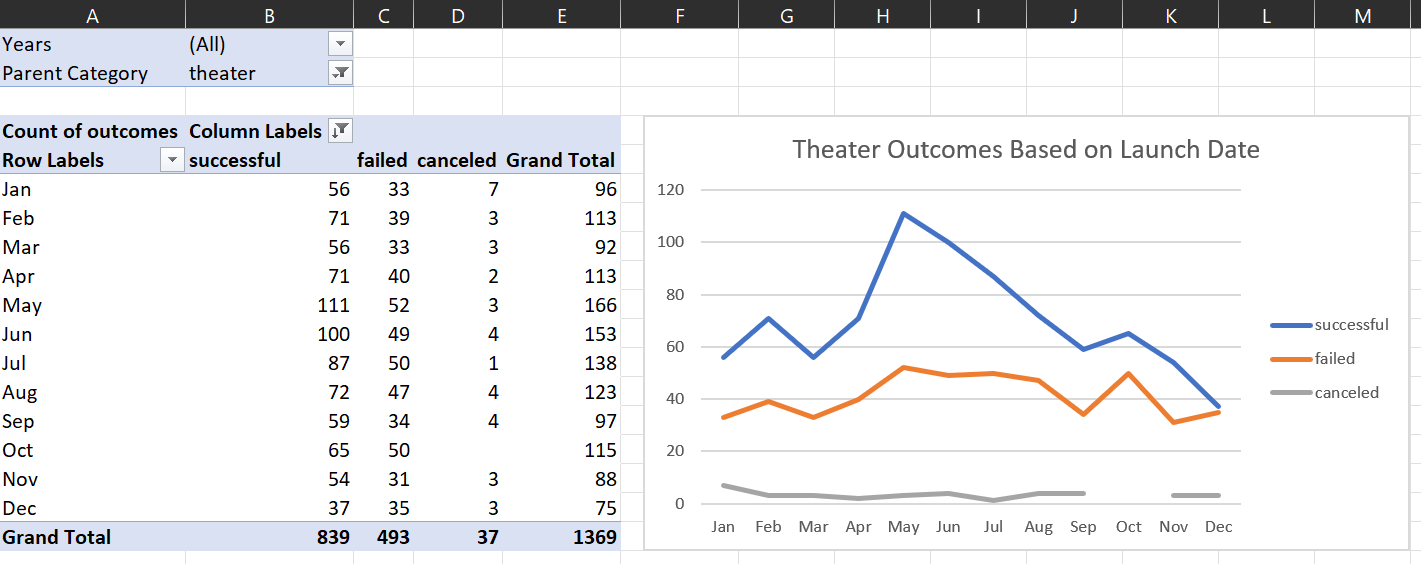
- A pivot table was created to investigate how the different outcomes were related to the months of the year, specifically for the theater category. The final table is presented in the image below
- A line chart was then created to visualize the data
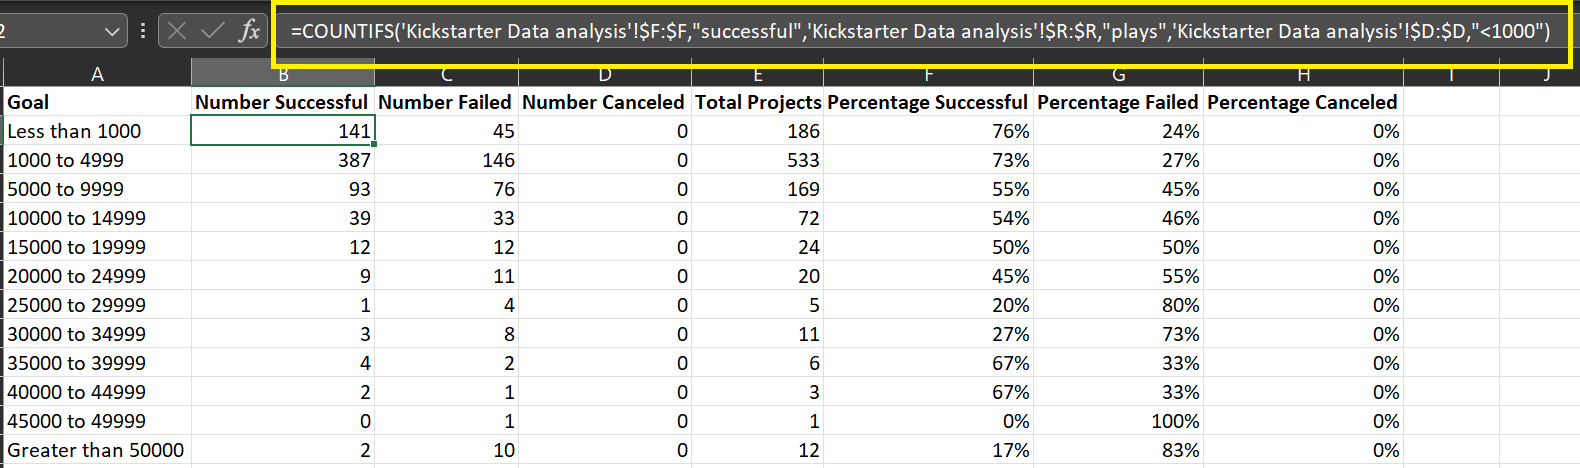
This analysis counts the number of successful, failed and cancelled plays and arranges it according to funding goals. The following steps were utilized in analyzing the data:
- A range was created for the funding goal. The number of outcomes for ‘successful’, ‘failed’ and ‘cancelled’ falling into each range was then counted. The Countifs() function in excel was utilized to do the analysis. As an example, the code used to count the number of failed plays in the range $20,000 to $24,999 is shown in the image below.
- The total number for each range was then calculated and percentage of each outcome within the different ranges were then calculated
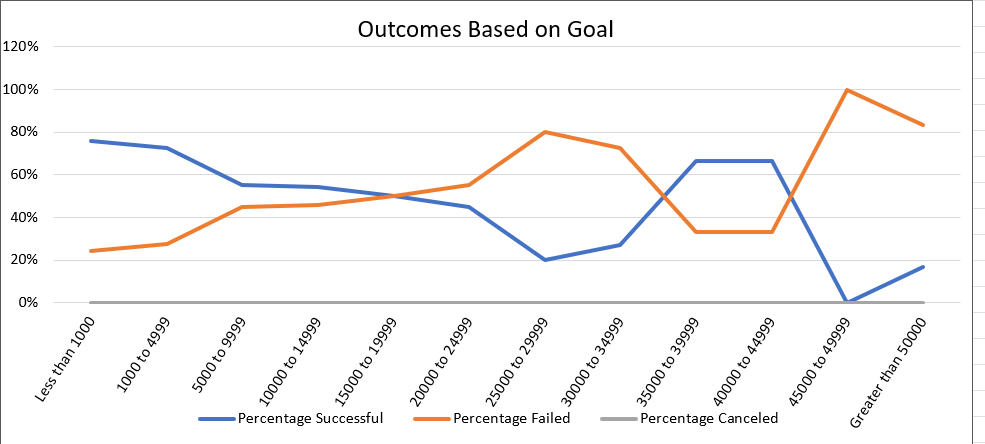
- A line chart was constructed for the outcome based on goals
From the analysis of outcomes based on launch date, it can be deduced that the probability of a successful outcome is highest during the period April to August, peaking in May. Aditionally, the number of failed outcomes is generally steady throughout the year, averaging around 41, and not necessarily affected by date. On the graph, this can be visualized from the line graph fluctuating only slightly around the count number 40. It can also be observed that there is no distinct peak and or deviation when compared to the successful graph for one to conclusively state a time period to avoid to prevent failure. In addition, cancelled outcomes aren’t affected by date.
It can be concluded that in general, plays will be successful for funding goals less than $19,999. Further, the percent of success generally decreases as the funding goals increases. The opposite is true percent for failed outcomes; that is, the rate of failure generally increases as the funding goals increases. However, there is a funding goal between the approximate 35000 to 44999 range where the general pattern is not observed, and the percent of success is higher than failure. Noteworthy, cancellations are not dependent on funding goals
- It would be interesting to know the factors that influence cancellation so it may be worthwhile investigating outcomes (either as a count or %) against category (and or subcategory for a deeper analysis) and constructing a bar graph.
- Another factor which may have a significant impact on the outcome would be number of backers. So creating a table and or charting outcomes vs backers (possibly in a range) could be constructed.
- If Louise wishes to create a successful play, she should also consider the country. Investigating outcomes based on location and on specific categories should be done.